
SmartWork Monitor
hours/month of manual logging - eliminated
hours/month of manager transcription - eliminated
days of data delay - reduced to real-time
illegibility errors with digital input
The application interface is in Croatian, as the client is based in Croatia. The UI terminology may not be immediately clear from the screenshots, but the visual structure speaks for itself.
The Problem
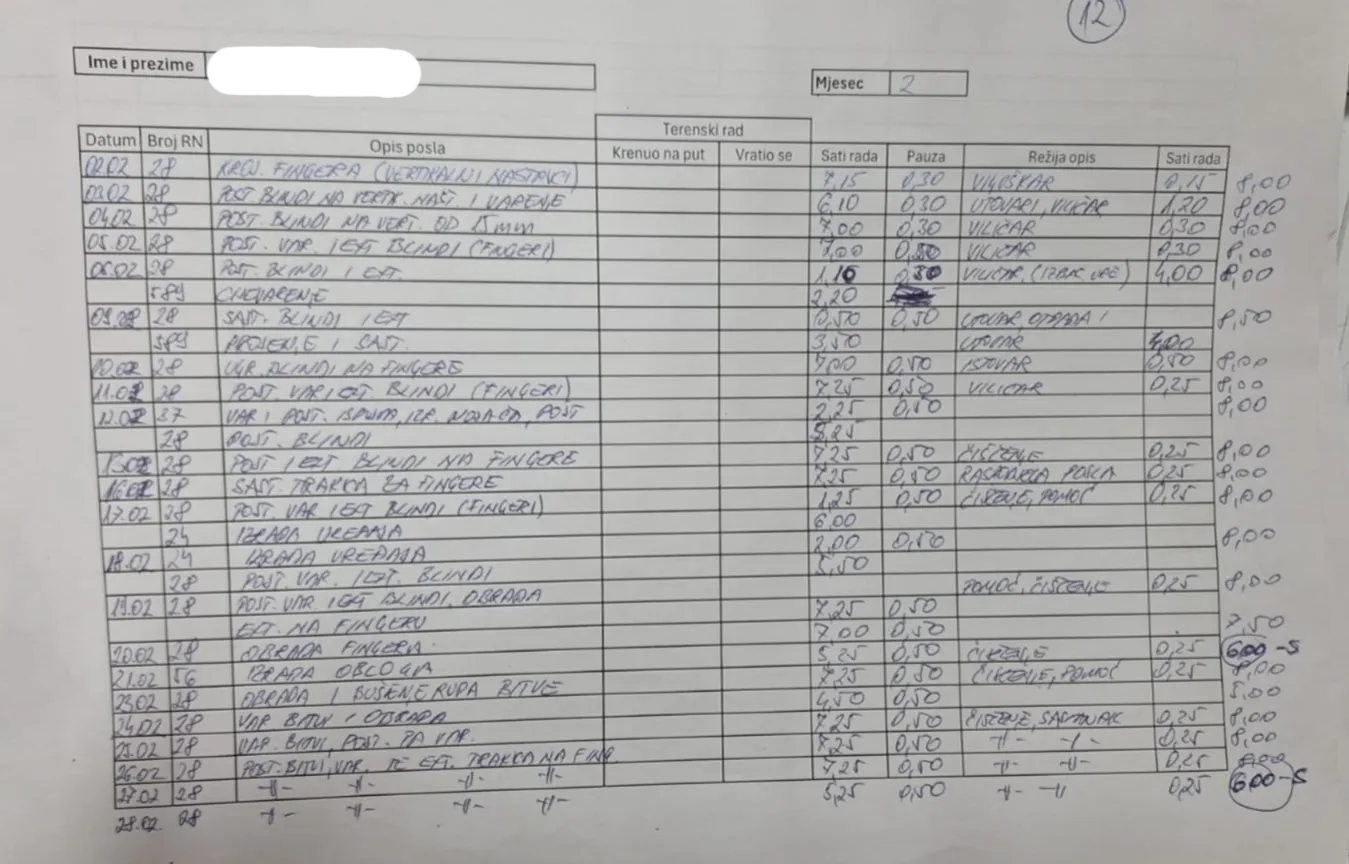
Every worker on a 30-person production floor had one simple task at the end of each shift: write down what they worked on. On paper.
Most didn't.
Instead of logging work daily, employees would sit down on the 1st of the following month and fill in everything from memory. What they worked on. How long it took. Which work order. All of it - reconstructed from 30 days ago.
The data was unreliable before it was even entered.
The math:
- 30 employees
- ~5 minutes per day
- 22 working days per month
That's 55+ hours per month spent reconstructing work history that nobody actually remembered.
The Hidden Bottleneck
That was just the workers' side.
The production manager had to manually transcribe all 30 handwritten A4 sheets into Excel. Every entry: dates, job descriptions, work order numbers, hours and minutes.
Illegible handwriting. Unclear abbreviations. Missing details. When something didn't add up, he'd call people, verify, correct.
5 to 6 hours per month. Every month.
And by the time the data was finally in Excel and usable, it was already 30 days old. Decisions about production, resources, and scheduling were being made on information from last month.
The Solution
We replaced the entire paper workflow with a real-time digital system.
Workers now log their activity with a few clicks. They select their work order, the operation, and start a timer. No paper, no end-of-month memory exercises, no transcription. Data enters the system the moment work begins.
30 Seconds to Start Working
They walk up to the workstation, tap their RFID card and the screen opens directly to their entry form. No login, no password, no waiting.
Three dropdowns:
- Work Order - a list of active orders, each showing the device they're working on
- Job Group - predefined options based on the selected work order
- Job Type - automatically filtered based on the selected group
One click leads to the next. Everything is connected. When they're done, they hit Start Job and the timer begins.
The process takes less than 30 seconds.
What the Production Manager Sees Now
Before this system, the manager had no visibility into what was happening on the floor until someone handed him a stack of papers at the end of the month.
Now he opens one screen and sees everything. Live.
Every worker. Every active job. Updated in real time as work happens on the floor.
Beyond the Live View
The live view is just the starting point.
The system includes a full statistics module with breakdowns by employee, work order, job type, and day. Every record searchable, filterable, exportable to Excel.
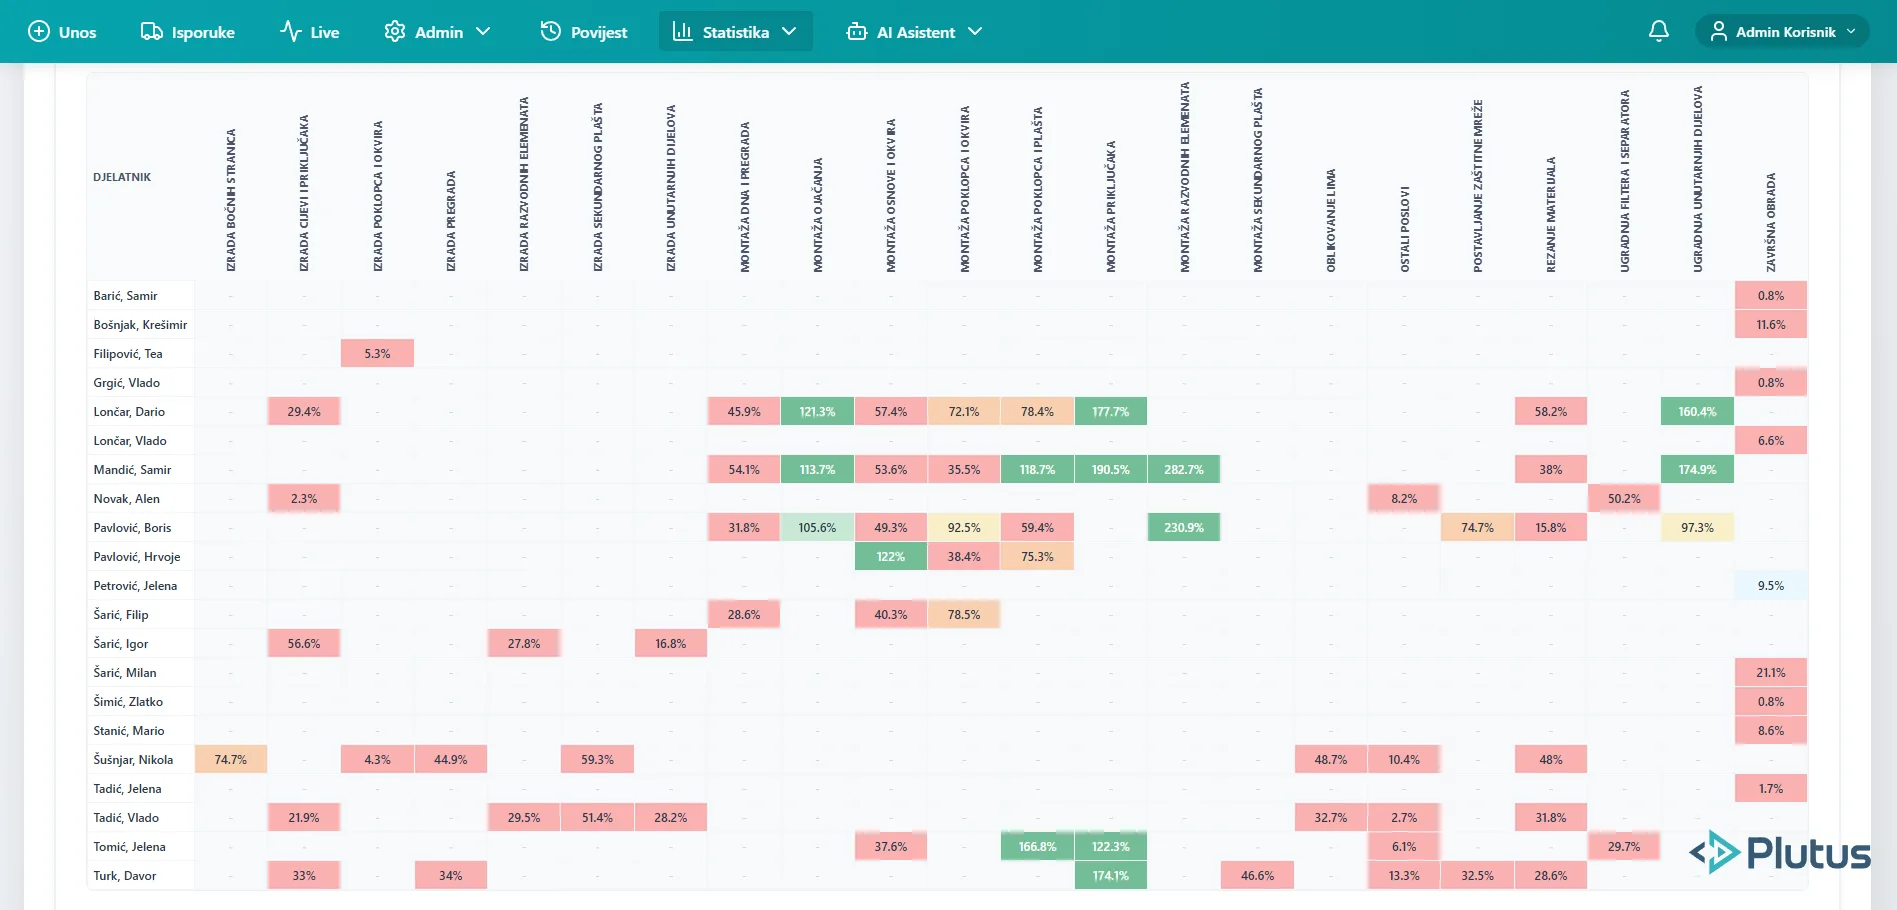
The Efficiency Heatmap
The most powerful insight comes from the norms heatmap.
Every cell shows one employee's efficiency on one specific job type. Green means ahead of target. Red means behind. Empty means they've never done that job.
At a glance, the manager can see who excels at which tasks, where someone needs support, and how to assign work for maximum efficiency.
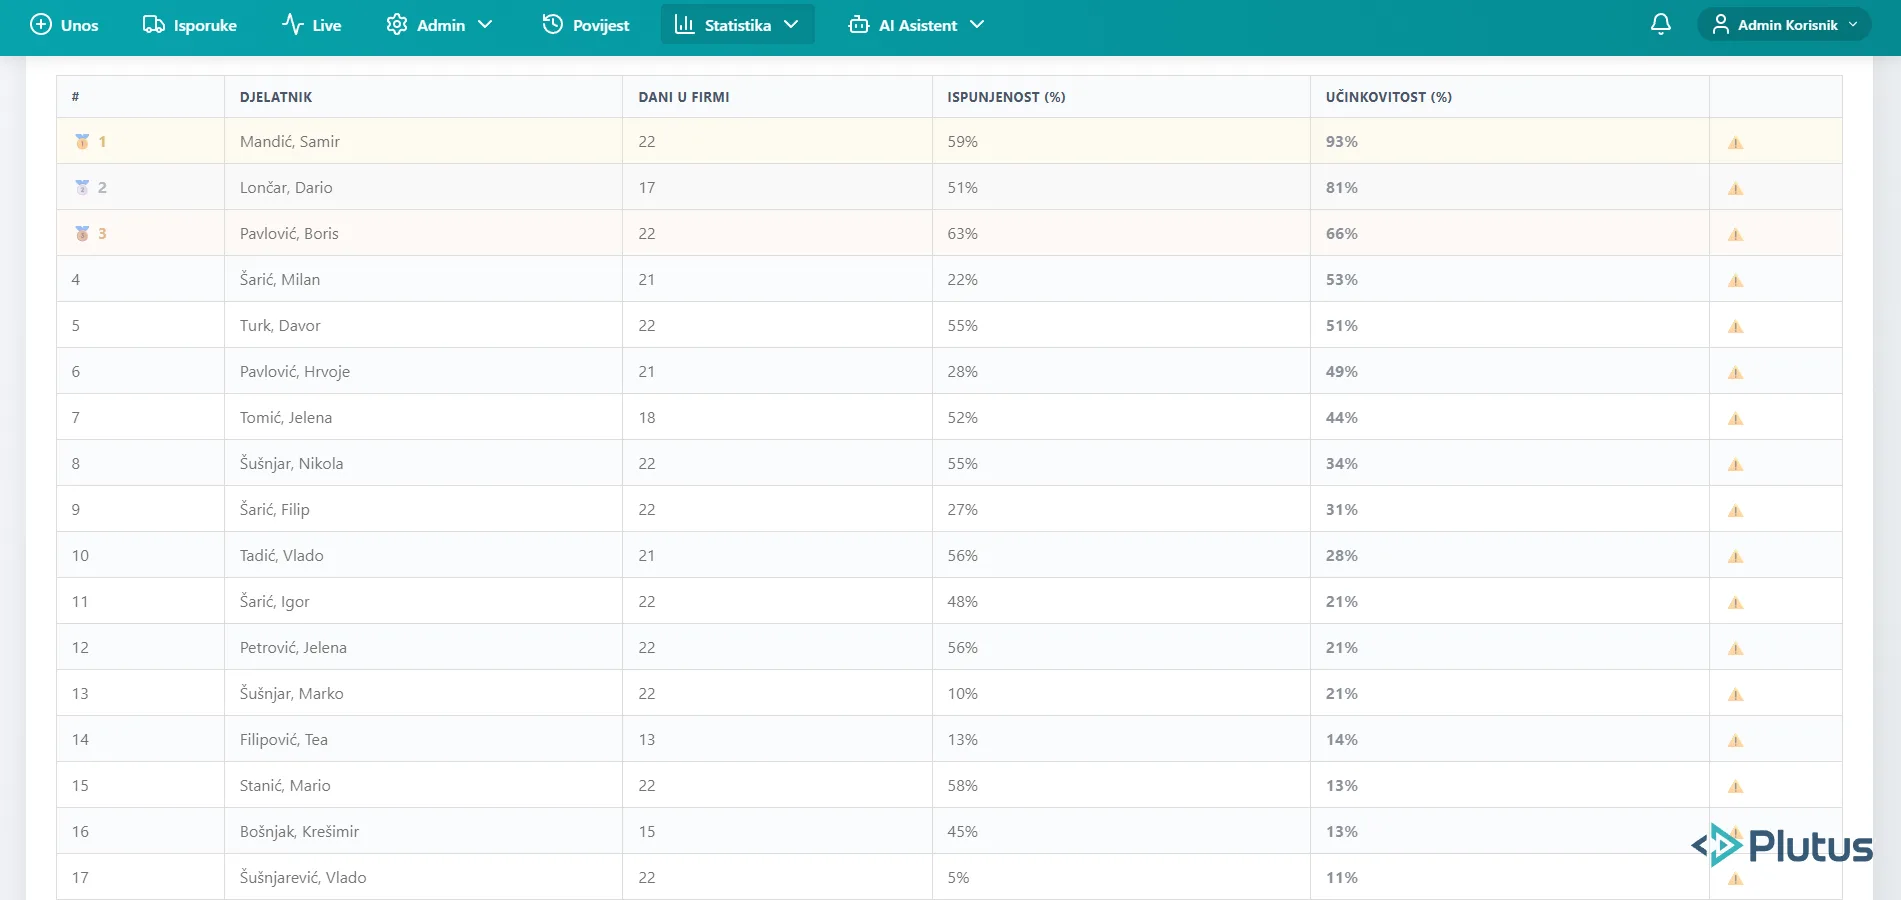
The Leaderboard
A leaderboard ranks every worker by efficiency - days worked, tasks completed, overall performance percentage.
Not just a vanity metric. This data feeds directly into how bonuses and performance reviews are handled.
The Results
The numbers speak for themselves:
- 55+ hours/month of manual employee logging - eliminated
- 5-6 hours/month of manager transcription - eliminated
- Data delay: from 30 days to real-time
- Zero illegibility errors
- Employee efficiency now measurable, tracked, and ranked
- Bonus decisions backed by data, not gut feeling
~1,450 hours saved per year.
The production manager went from spending a full working day every month reconstructing old data to having everything at a glance, live, updated by the minute.
Gallery
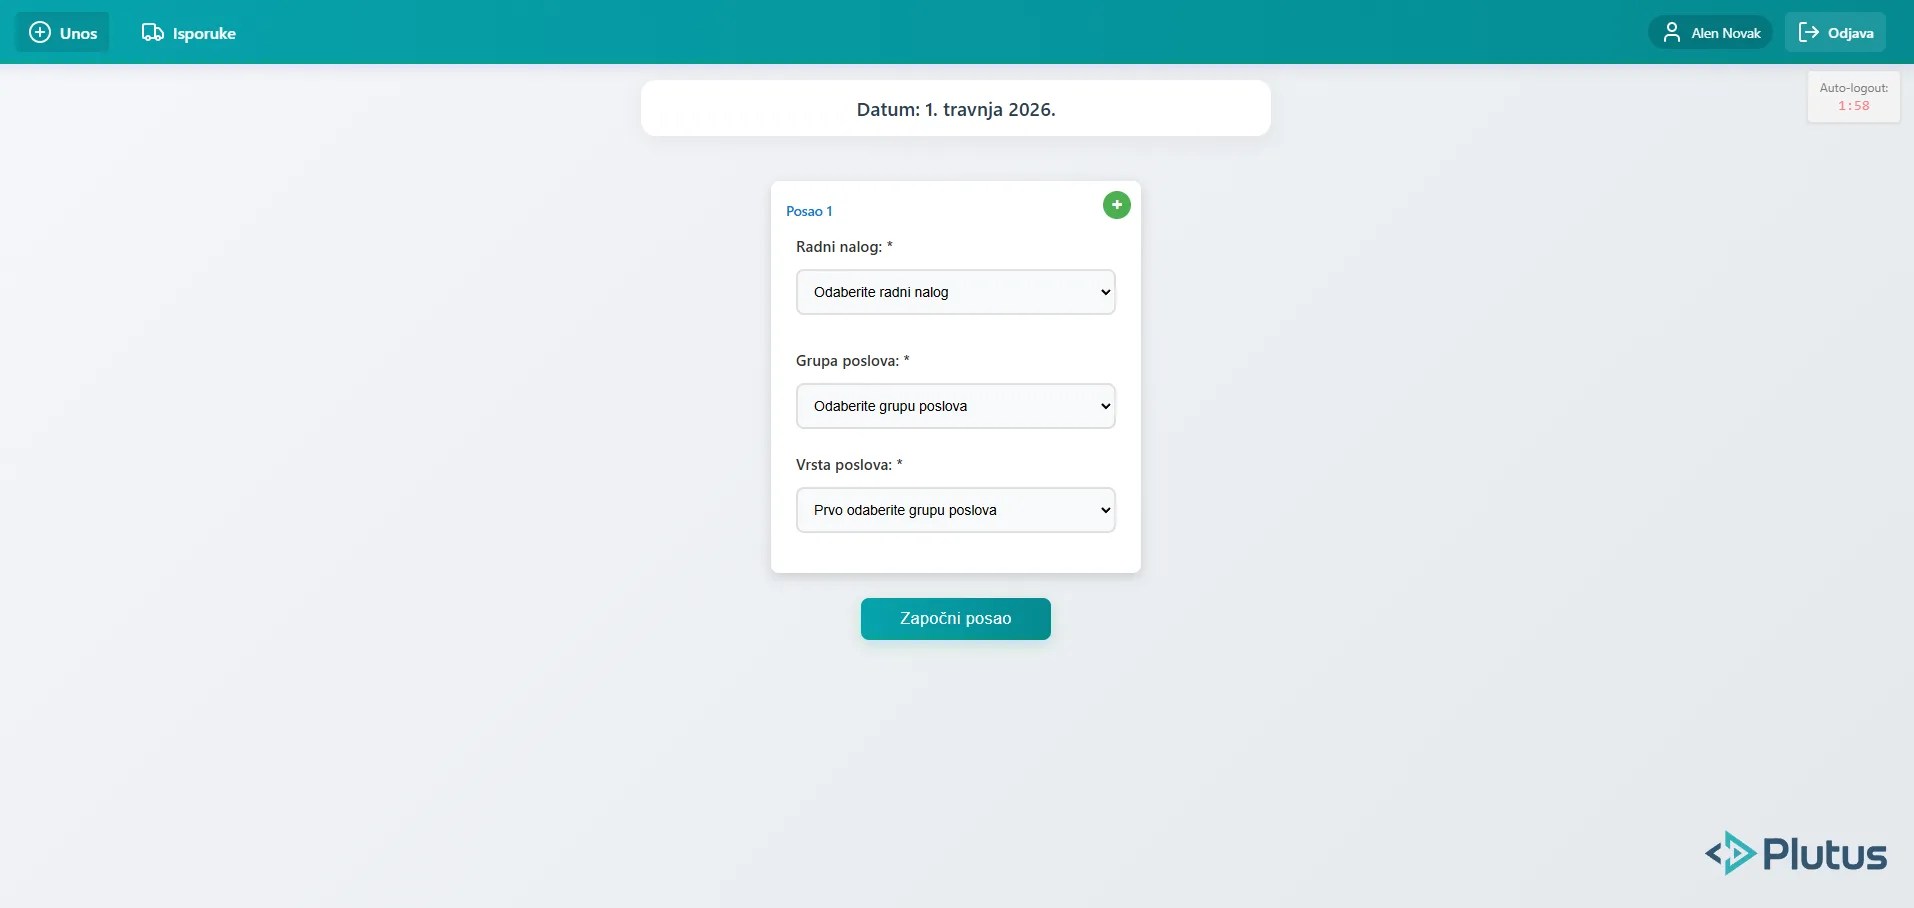
Digital work entry form - worker selects work order, job group and job type
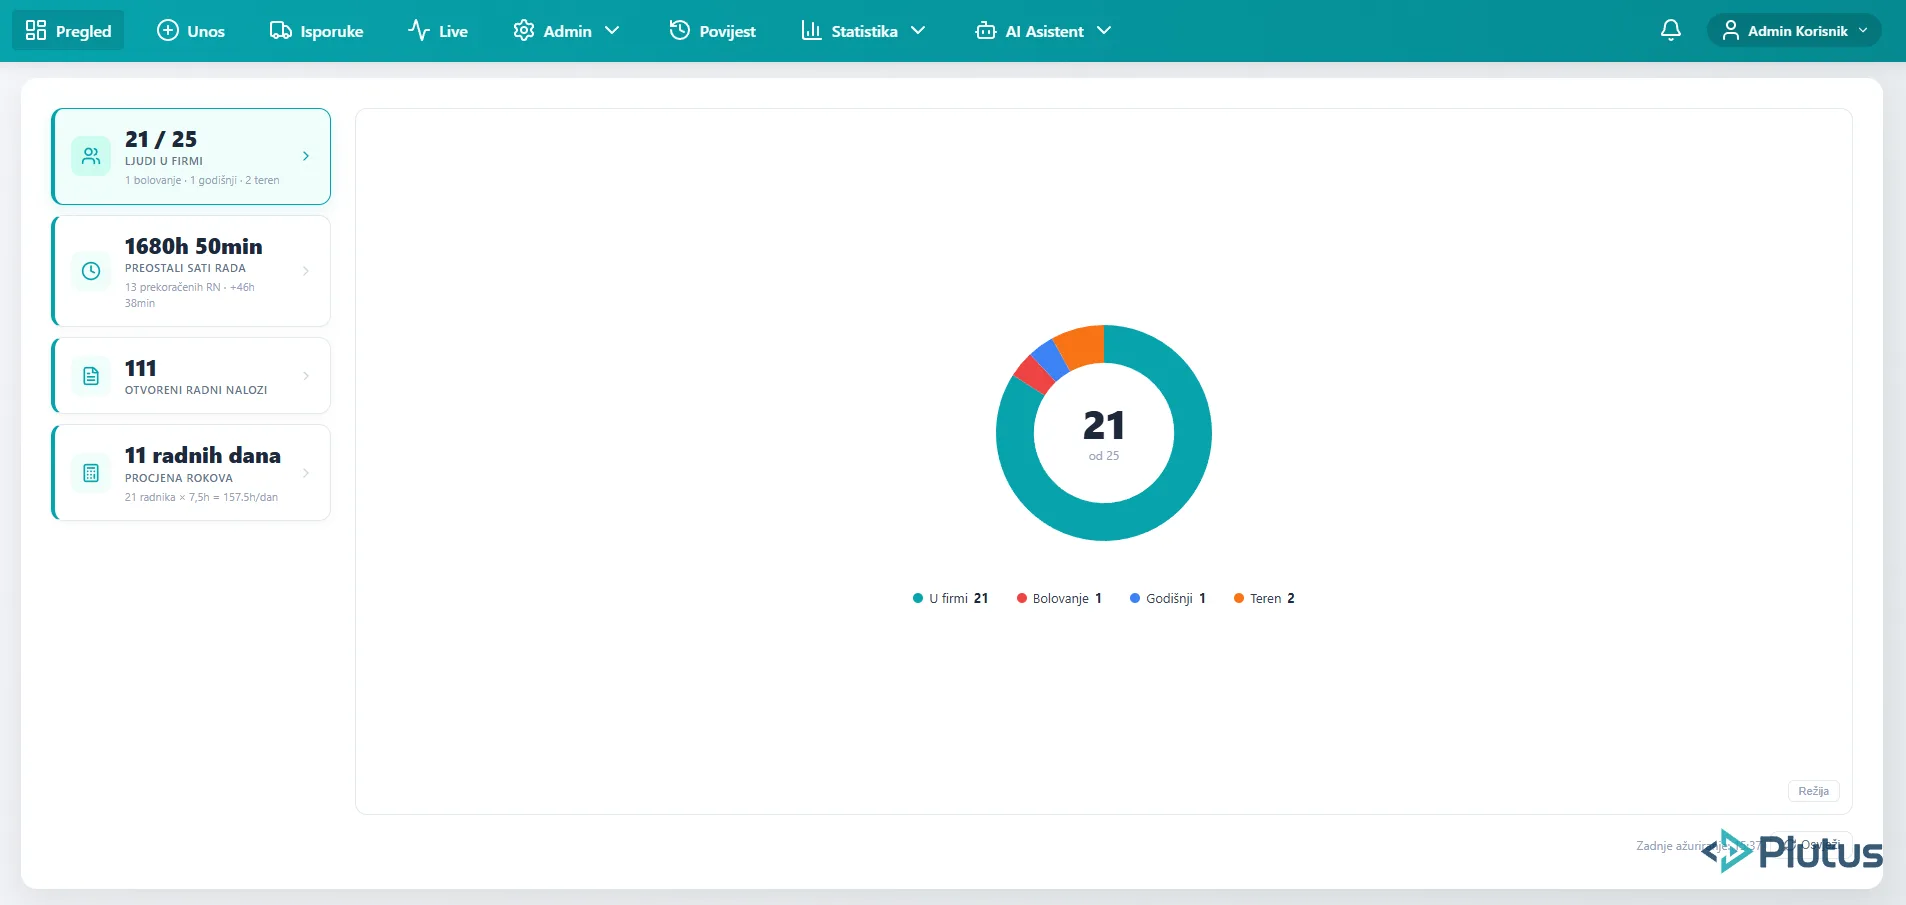
Employee attendance overview - real-time status of all workers on the production floor
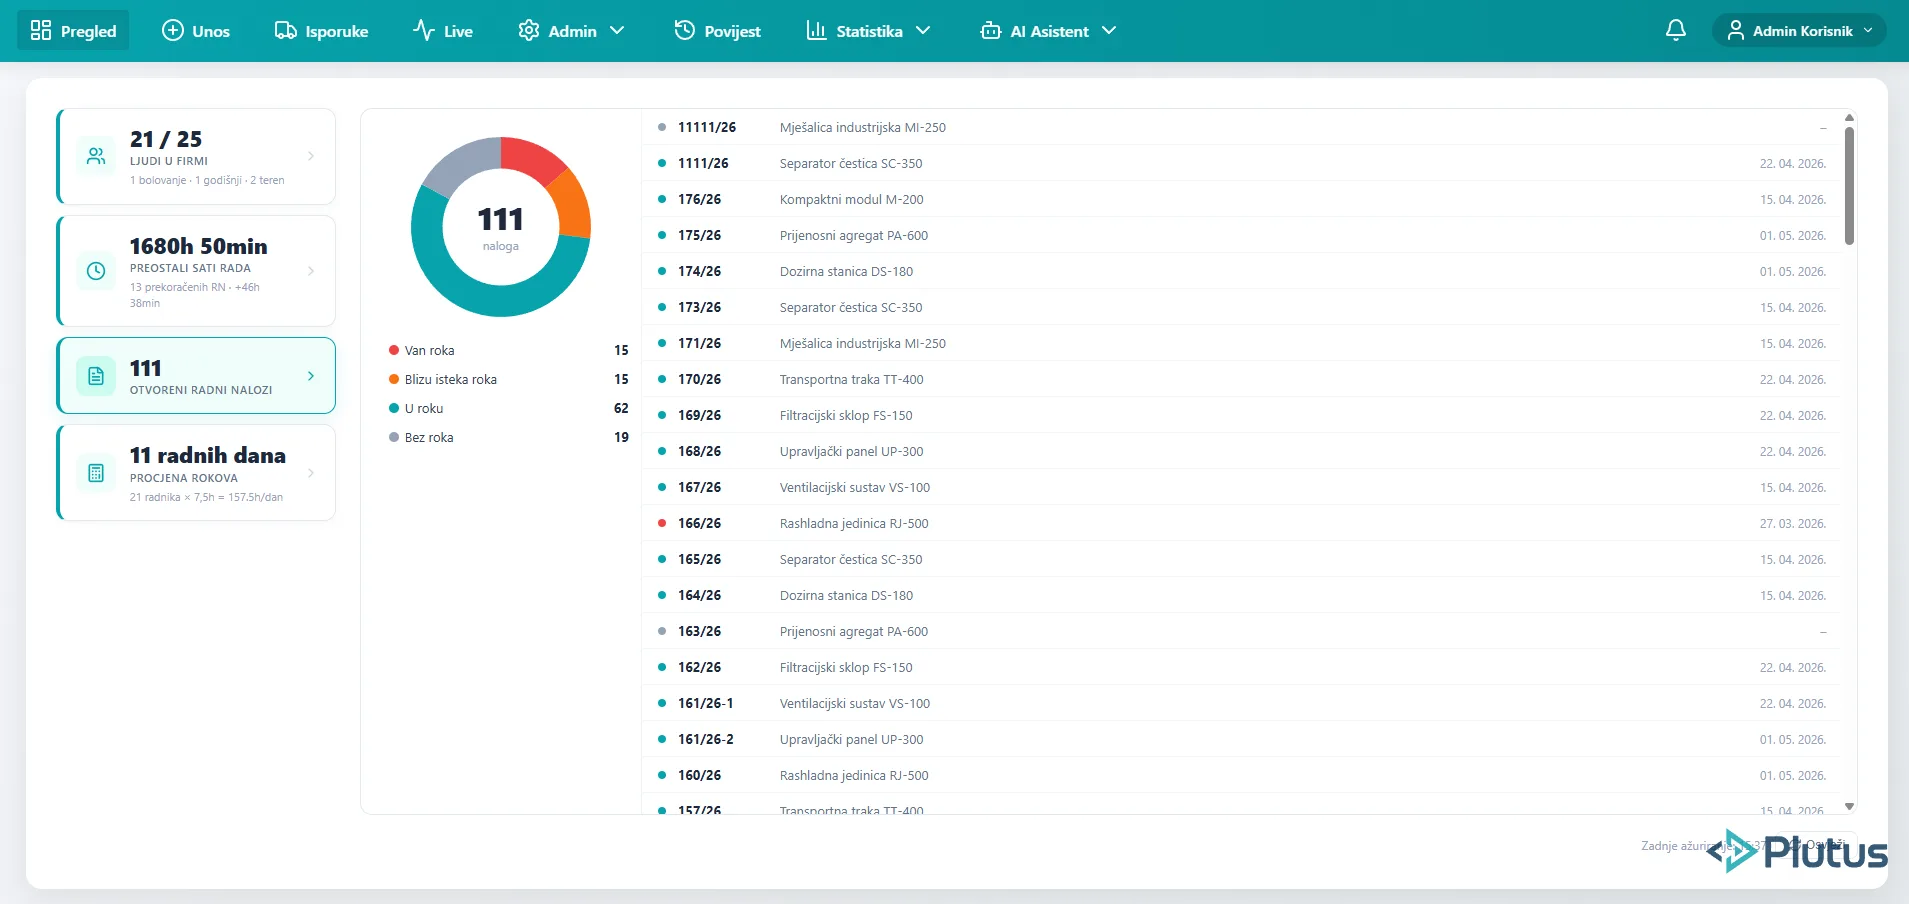
Open work orders panel - urgency breakdown with detailed order list
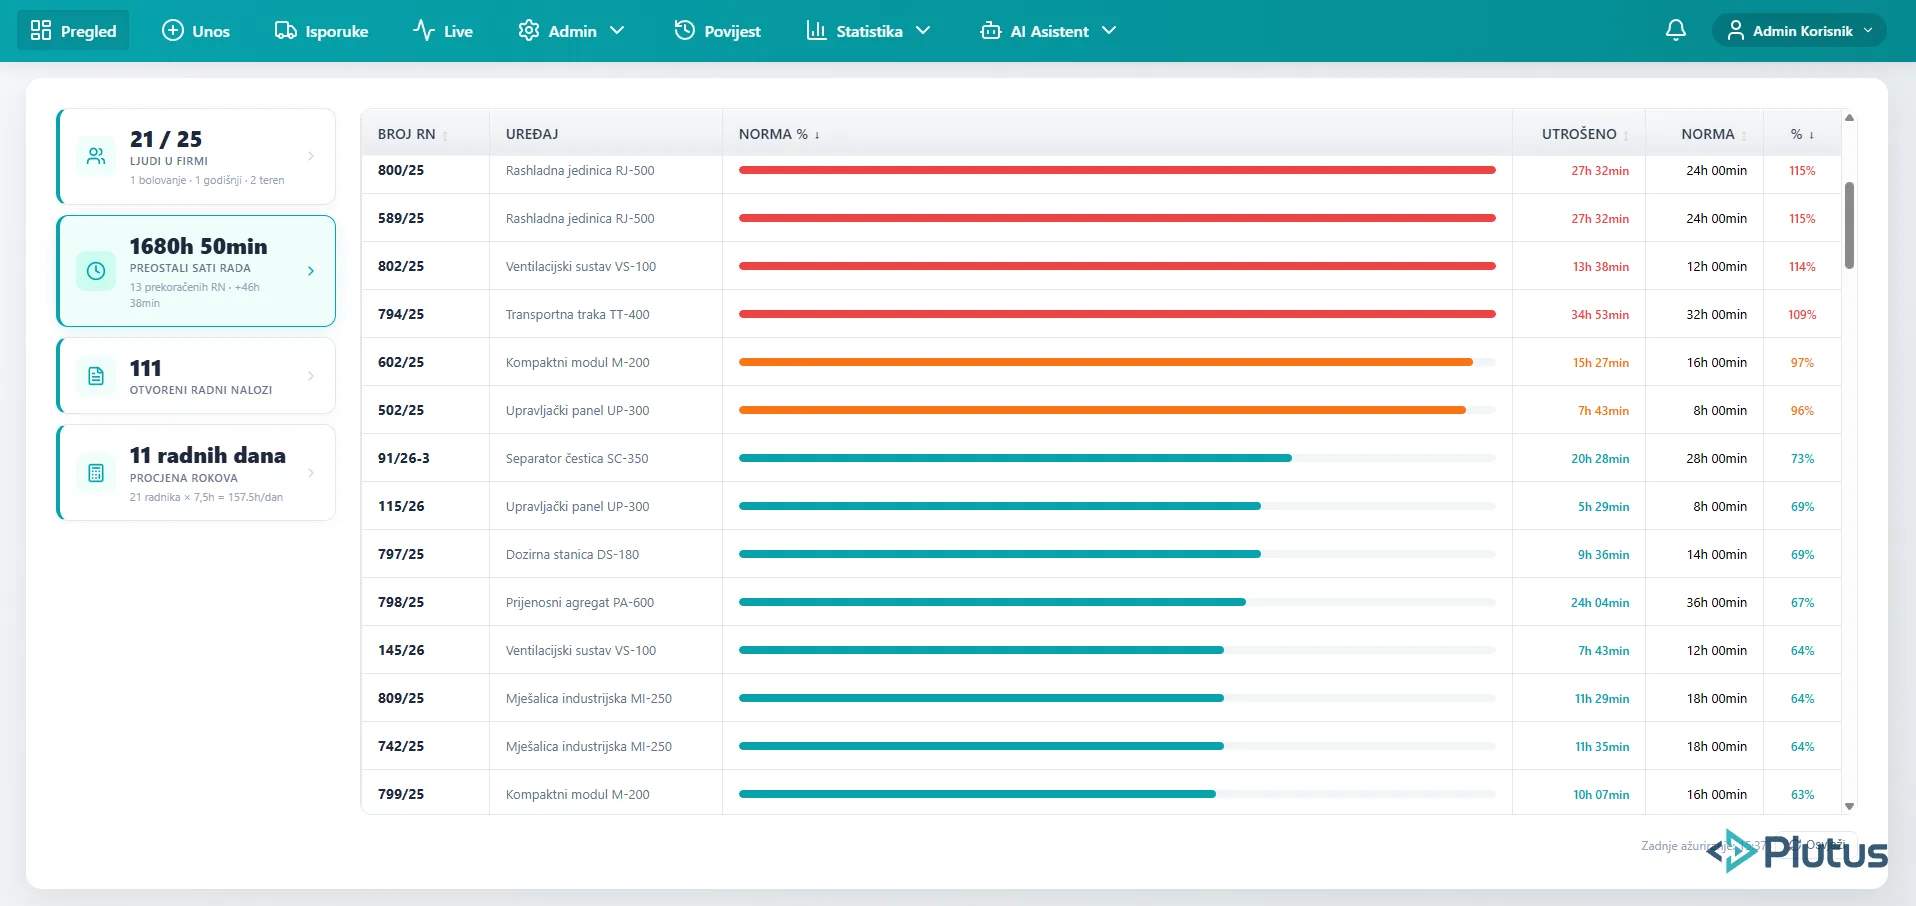
Remaining work hours - norm progress bars showing completion status per work order
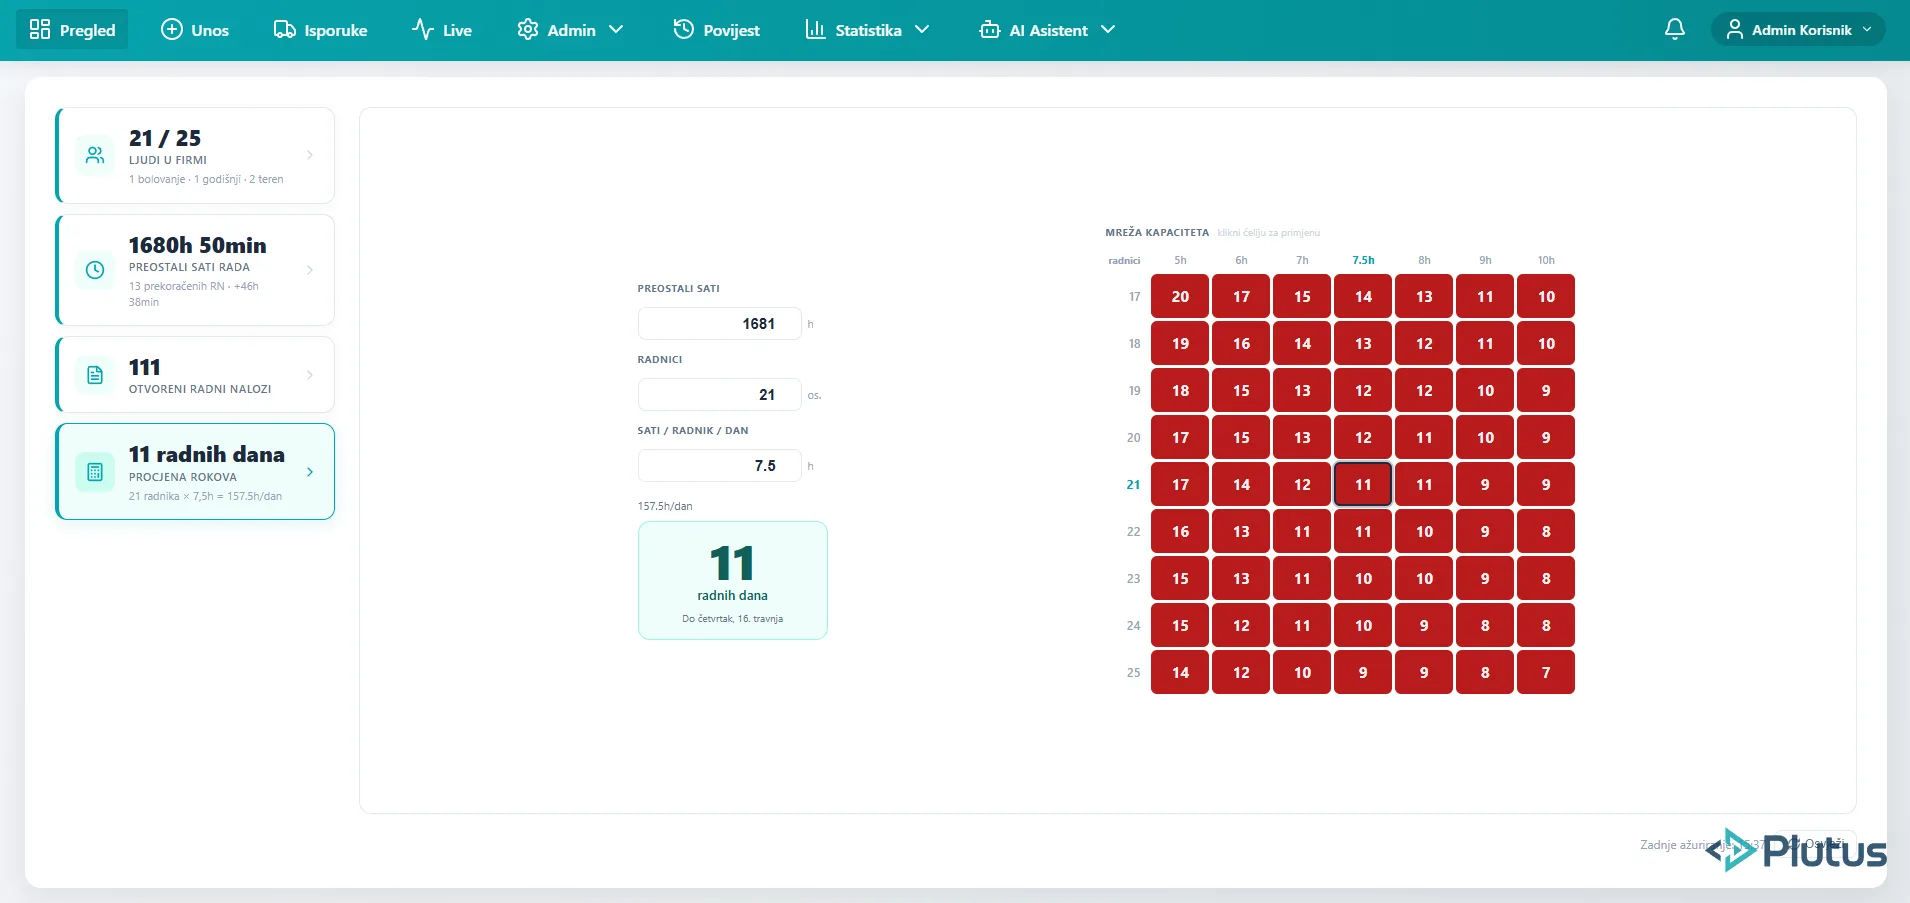
Capacity calculator - estimated completion days based on workforce size and daily hours
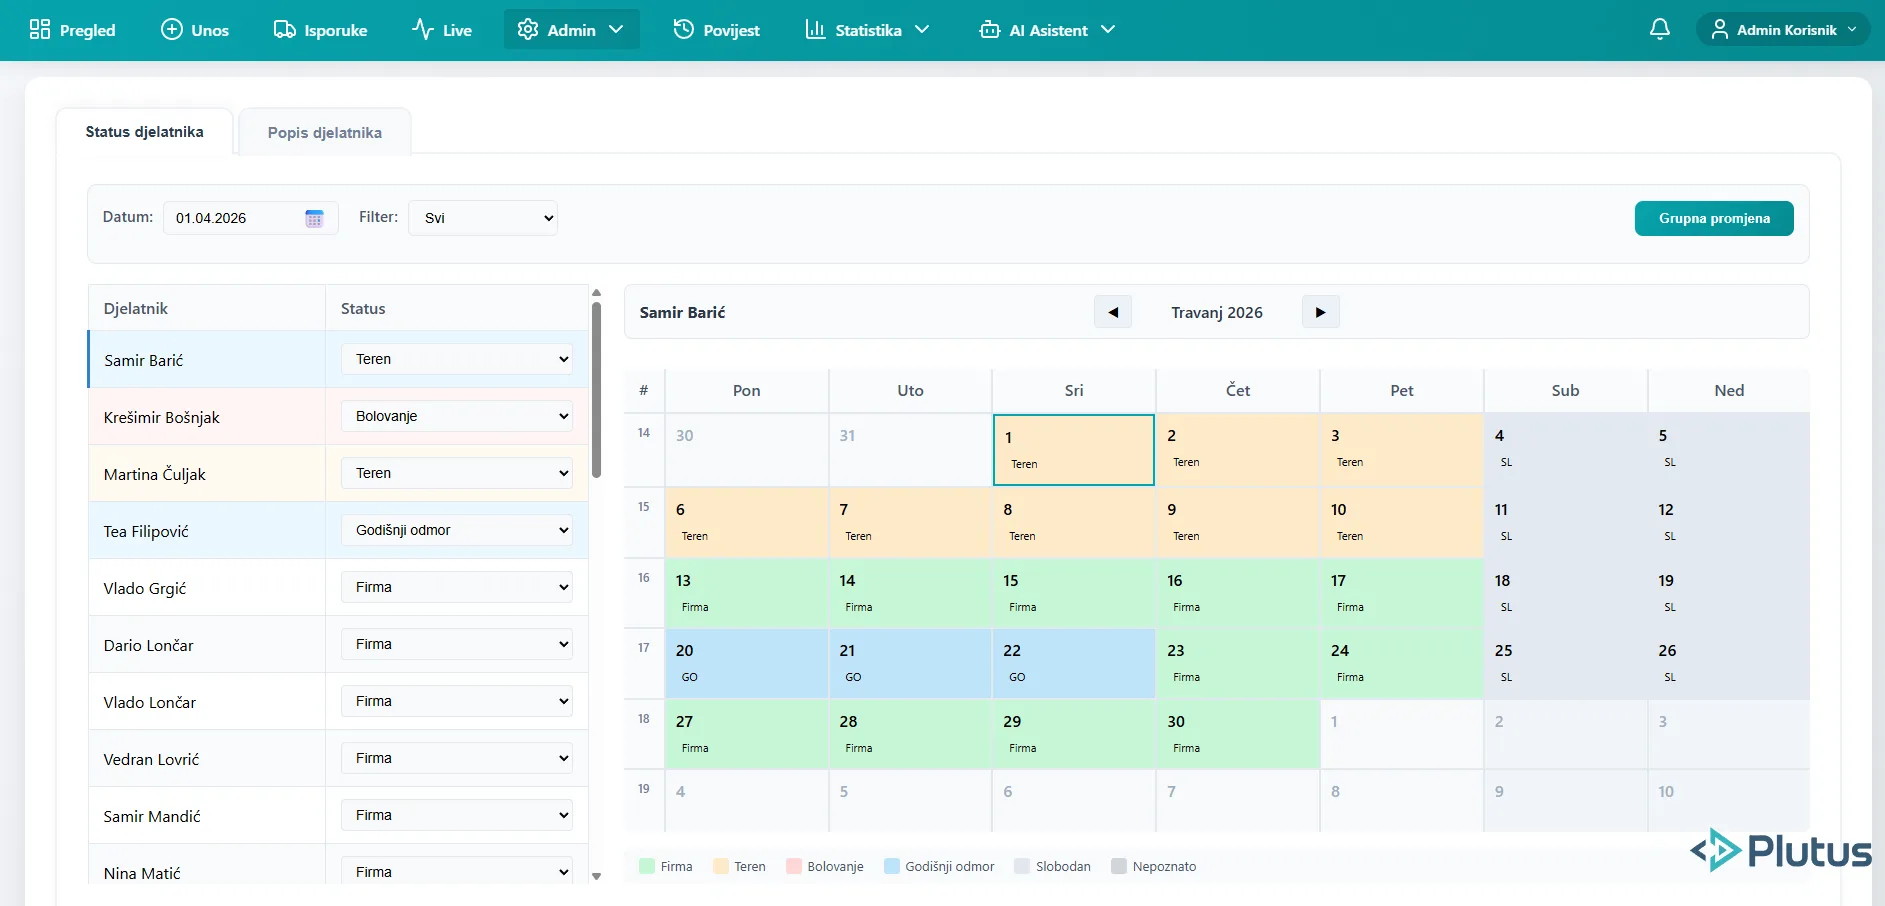
Employee attendance calendar - daily status tracking with color-coded categories
Tech Stack
Need something like this?
Let us show you the real growth opportunities for your business.
SCHEDULE A CALL